|
Advanced Candle Stick Techniques Many traders prefer candle stick charts over bar charts. If you have never heard of Candle Stick charts, you might want to review the article in this link before reading the rest of this page; http://scientifictrader.com/engulfing_formation.htm One reason they are often perferred is that they are much easier to read for most. At a glance, you can tell where the price is headed because the current predominant color of the candle sticks stands out. If you are like most and you use white for up black for down, and the majority of the recent candle sticks are black, then you know the trend is down. Another advantage of candle sticks over bar charts is that they also make it easy to see where the closing price is, and is headed in relation to the total price movement for the day, but there are much more to candle sticks than just ease of use. Candle Stick Patterns If you have been trading for awhile, then you have probably heard of the patterns that traders look for in candle sticks. There are many, the evening star, the morning star, inverted hammer, three white soldiers, and the list goes on and on. If you are interested in candle stick patterns, then you would be doing yourself a big favor by not just memorizing the patterns, but spending time to learn the interpretation of the pattern in relation to trading. For example, look at the candle below;
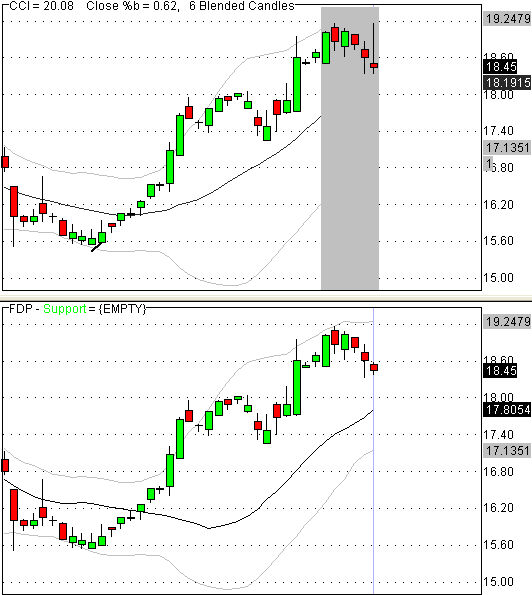
What can we discern from this? Well we can see that the price closed higher than it opened. Often someone may see this as an indication that the buyers are stronger than the sellers, and thus price will likely continue up. However, when we take into consideration the fact that the shadow on the top is very tall compared to the body of the candle, this shows that the buyers are actually very week. Why? Because they attempted to bring the price up, and in this case failed miserably, if this happened at the top of a swing or a trend, in which case this candle would be called a Shooting Star. Then it would be considered a bearish signal, an indication that prices were about to reverse downward. If you get in the habit of trying to analyze candle sticks this way, that is to figure out who is in control between the buyers and sellers, or if the control is shifting, one getting weaker, and / or the other getting stronger, then you are arming yourself with additional insight that will better equip you to the future price movement. Blended Candles Here is something you won’t hear about often, blended candles. What are they? Well it’s how some advanced candle stick users look at charts. It’s a way of taking the patterns mentioned above that require multiple candles and turning them into one. When you do this, it can also help reveal what is happening between the buyers and the sellers that you might not otherwise notice. Here is an example. There are two identical daily price charts below of FDP. The only difference is that the top chart has combined the six most recent candles into one by using the open of the candle six bars ago and the close of the current bar. The shadow of the current candle is made up of the rest of the up and down price movement over those six bars. To make this easy to spot, all of the candles in the grey background are the ones that make up the most recent candle. The bottom chart are the normal candles. Notice how the most recent candles in the two charts differ from each other.
Did you notice something familiar? The most recent candle in the top chart looks similar to our Shooting Star we just discussed. It would be nice to see it higher in relation to the last few bars, but it still gives an indication of weakening Bulls. What happened next? Take a look;
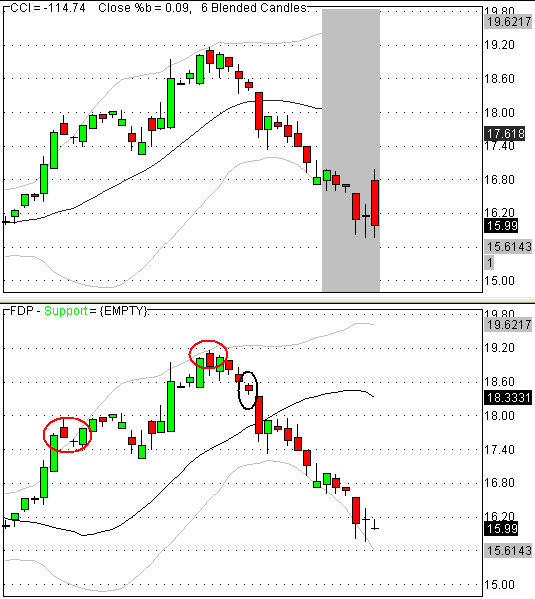
We started where the candle in the lower chart is circled in black. Here as a confirmation to the weak candle, you might have take as a confirmation the weakening relationship of the price to the upper Bollinger Band, as indicated by the red circles. This can have a similar effect of viewing a larger time frame, with the additional insight of the candle stick patterns. Why did I blend six candles? Well, I don’t think there is a perfect number to use. I programmed my charting software to be able to toggle the number of blended candles up and down, but all you have to remember is that the opening is derived from the first candle and the closing is from the current candle, then with a little practice you can visualize it to see what’s going on. A candle pattern, blended or otherwise, is just another tool for technical analysts, and not meant to be used by itself as an entry signal. It is always wise to confirm the information it provides with another indicator, such as volume (my favorite), RSI, moving average, etc.
All email addresses are kept confidential and are never shared with anyone.
KNOWLEDGE IS POWER For more easy to follow strategies, click here
Terms and Conditions / Risk Disclosure online stock trading | stock market trading Copyright 2008, All Rights Reserved
|