|
How To Profit From Exponential Moving Averages!
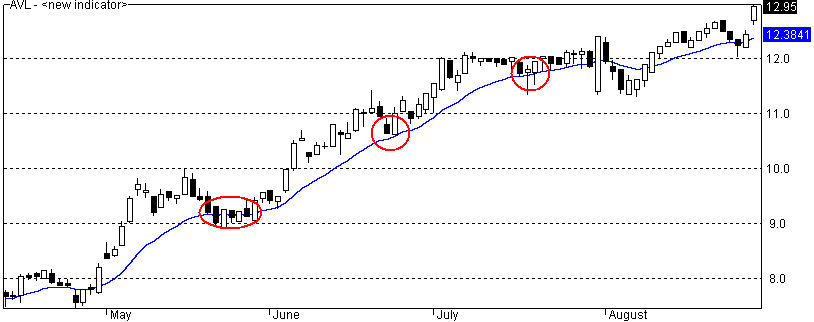
If you are still using simple moving averages, then you might want to read the article on simple moving averages. Today we will see how we can derive an entry signal from an exponential moving average. There are a few points we can discern from looking at a moving average. The most important point is the direction of the price movement relevant to the length of the moving average. Without getting into the nitty gritty of the mechanics of what makes the price of a stock rise and fall, you at least need to know that when the price is above a moving average, there is more buying than selling pressure when compared to the trades that have taken place during the time the average covers. When the price is below the moving average, there is more selling pressure when compared to the trades that have taken place during the time the average covers. Because we are comparing the current position of the price to it's past position, we are attempting to follow a trend. This is why a moving average is considered a "trend following tool". So when the moving average is basically flowing upward, we would only consider entering long positions. When the moving average is flowing downward, we would only consider entering short positions. What if it doesn't appear to be flowing either direction? Either lying flat or evenly oscillating up and down? Excellent question! This would indicate the absence of a trend and a "trend following tool" would not prevail. It would be best to move on to another trading candidate or use a different technical analysis tool that doesn't employ trend following. Below is a chart of AVL. Note how during May through August the price is not only above the ema (exponential moving average), but the ema is also flowing upward. This sets the scene. We then wait for the price to touch or come close to the ema. When it does, we look to enter after the price exceeds a series of falling highs. Note the red circles in the chart below;
You can see above that the first two entries are are good, while the third one is not. Is every stock as clear cut as this example? No, some are clearly good candidates. Some are clearly bad ones. The rest fall somewhere in between. How close you need to be to the "clear zone" is up to you and is determined in part by your experience, your level of comfort for risk, and the risk reward ratio that you determine exists for the trade in question. But don't sweat it if you are not comfortable with the stock in question, there are plenty of fish in the sea! In our next article, we'll discuss how to determine the correct length of a moving average. This is important because while the correct length can provide us with some valuable insight regarding price movement, using a moving average that is too short or too long can not only be misleading, but can leave us crying over our trading account! If you are not currently subscribed to our newsletter and would like to learn about other profitable trading tips and resources, simply enter your name and email address below and we'll be glad to share them with you.
All email addresses are kept confidential and are never shared with anyone.
KNOWLEDGE IS POWER
Terms and Conditions / Risk Disclosure
Copyright 2007, All Rights Reserved
|